Abstract
Bangladesh faces critical challenges in balancing electricity generation with demand, leading to resource wastage, high costs, and load shedding. We present GridGenius, a novel, fully deployed AIArtificial Intelligence-powered platform for accurate and explainable daily electricity demand forecasting.
The system uses a hybrid model integrating classical MLMachine Learning (Random Forest, XGBoost) with a custom Transformer regressor, achieving R²Coefficient of Determination: How well predictions replicate real data points (0-1 scale). scores up to 0.89. A unique dataset from 1,800+ daily BPDBBangladesh Power Development Board reports (2020-2024) was created, enriched with holiday, temperature, and seasonal data.
GridGenius incorporates a RAGRetrieval-Augmented Generation: Enhances LLM answers with external knowledge. pipeline with a LLMLarge Language Model (e.g., Llama 3) for transparency, allowing natural language queries about forecasts. Deployed as a web app, it offers a scalable, transparent solution for smarter grid management.
Introduction
Bangladesh's energy sector is marked by a persistent struggle to align electricity generation with national demand. This imbalance results in frequent load shedding, inefficient resource use, and significant economic consequences. Despite generation capacity growth, the BPDBBangladesh Power Development Board [1] still grapples with demand-supply mismatches, especially during peak periods and seasonal transitions. A key bottleneck is the lack of dynamic, interpretable, and real-time forecasting systems [3] to guide grid optimization efforts.
Traditional forecasting approaches, including statistical models (ARIMAAutoregressive Integrated Moving Average) and basic MLMachine Learning techniques, often fall short. They may struggle to generalize across time scales, ignore crucial external factors like holidays or weather patterns, and lack the scalability needed for daily operational deployment. This highlights the need for an intelligent, adaptable system providing accurate daily forecasts coupled with clear, understandable explanations.
Our Contribution: GridGenius
GridGenius is designed to fill this gap by integrating novel, state-of-the-art AI techniques:
- A Hybrid Modeling Strategy: Combines established ML algorithms (Random Forest, XGBoost) with a custom Transformer architecture [2].
- Novel & Enriched Dataset: A comprehensive daily record (2020-2024) from BPDB reports [1], enhanced with temperature, holidays, and engineered features.
- Explainable AI (XAIExplainable Artificial Intelligence) Core [3]: Utilizes a RAGRetrieval-Augmented Generation [4] pipeline with Llama 3.1 [14] for transparent, natural language interaction.
- Full Deployment: An novel interactive web application providing forecasts, visualizations, and conversational insights.
Methodology
GridGenius follows a systematic pipeline:
- Data Collection & Preprocessing
- Exploratory Data Analysis (EDA)
- Feature Engineering
- Model Development & Training (Hybrid Approach)
- Explainability (RAG-LLM Integration)
- System Deployment

A. Dataset Collection & Description
Unique dataset scraped from 1,800+ daily BPDBBangladesh Power Development Board reports (Jan 2020 - Mid 2024). Includes Max Demand (MW), Max Generation (MW), Date, enriched with Daily Avg Temp (°C) & National Holiday flag.
B. Exploratory Data Analysis (EDA)
EDAExploratory Data Analysis revealed key patterns:


C. Feature Engineering & Data Iterations
Features engineered: Demand-Gen Gap, Season Classification, Holiday Flag. Preprocessing: Outlier handling (IQRInterquartile Range, Z-score), Scaling (MinMaxScaler, StandardScaler). Four dataset variants created for robustness testing.
D. Modeling Pipeline
Models explored: Linear Regression, Random Forest (Top Classical), XGBoost, SVR, Transformer (Custom DL). Tuned RF/XGBoost via RandomizedSearchCV.
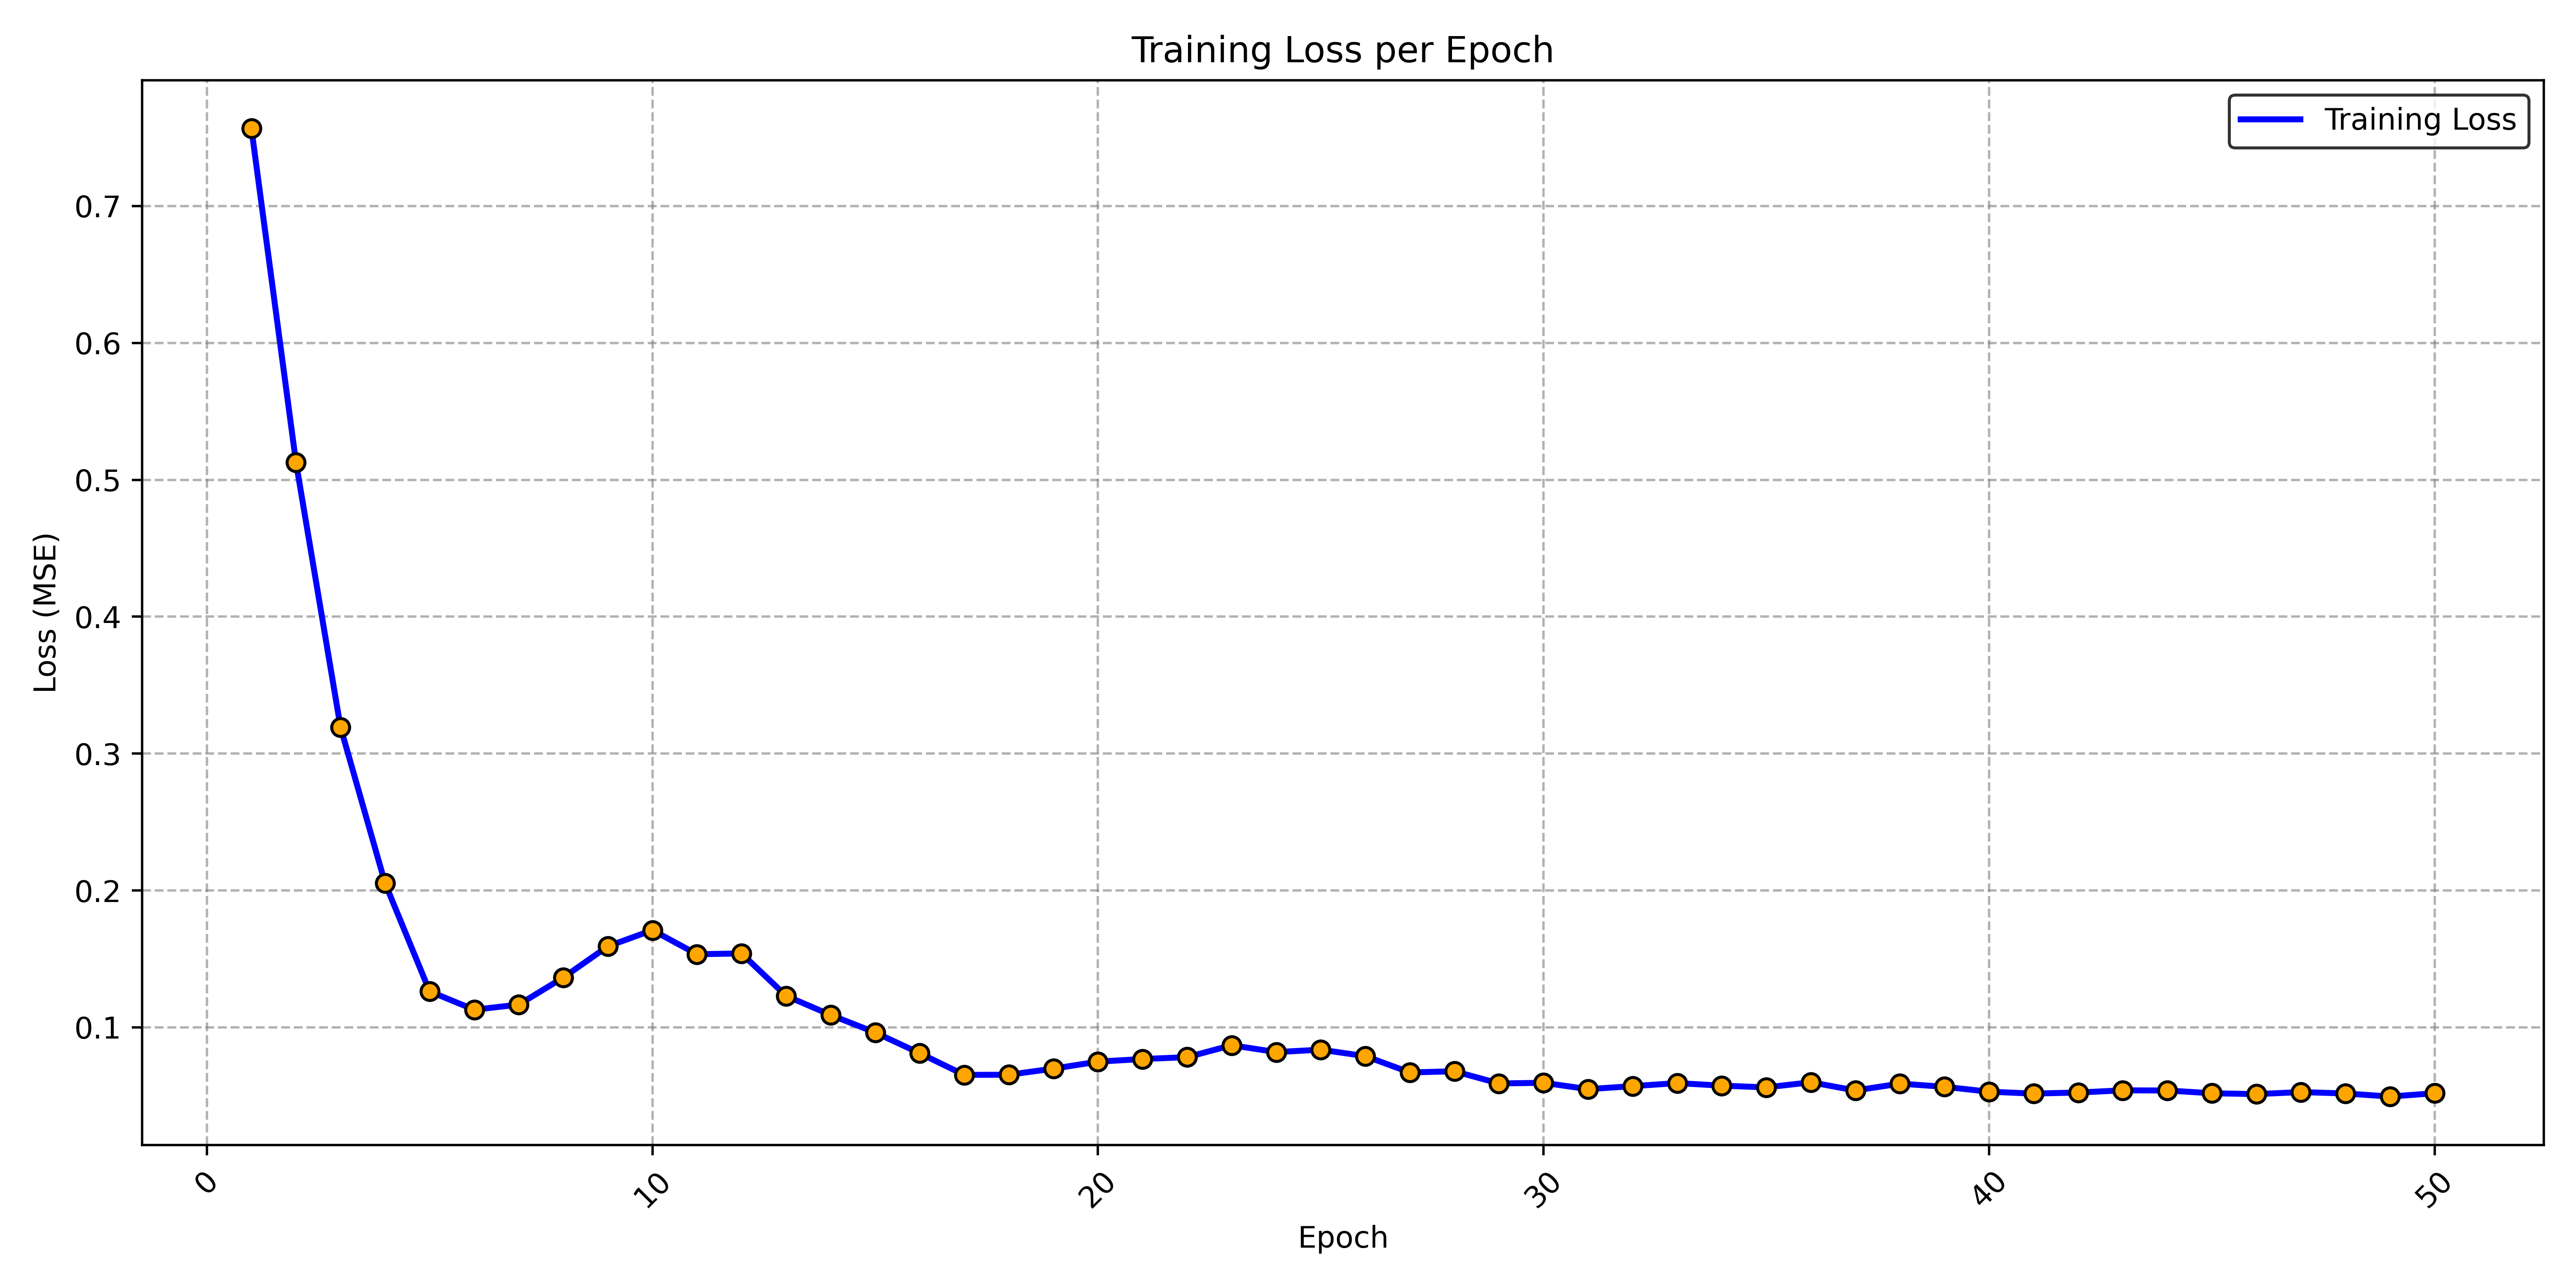
E. Primary Model: Transformer Regressor
Custom Transformer [2] with multi-head self-attention, feed-forward layers, positional encoding, dropout. Trained with Adam [12] optimizer & MSEMean Squared Error loss.
| Parameter | Value |
|---|---|
| Optimizer | Adam [12] |
| Loss Function | MSE |
| Training Epochs | 50 |
| Key Hyperparameters Tuned | num_heads, model_dim, num_layers, dropout, learning_rate |
F. Explainability via RAG-LLM
Achieved using RAGRetrieval-Augmented Generation [4]: ChromaDBVector Database [13] stores context (docs, stats) embedded via Google/HF models [26, 27]. Llama 3.1 [14] on GroqFast LLM Inference API [15] generates answers based on retrieved context, enabling natural language queries.
G. Deployment Architecture
Modern stack: FastAPIPython Backend Framework [16] backend on RailwayCloud Platform [28], Responsive frontend on VercelCloud Platform [17], persistent ChromaDBVector Database [13], GroqFast LLM Inference API [15] for LLMLarge Language Model.


Results and Experiments
A. Experimental Setup & Tools
Hybrid setup (Colab T4 GPUGraphics Processing Unit, RTX 3060, M1 Mac). Libs: Sklearn [18], TF [19]/Keras [21], PyTorch [20], NumPy [22], Pandas [23], Matplotlib [24]/Seaborn [25], FastAPIPython Backend Framework [16], ChromaVector Database [13], etc.
B. Evaluation Metrics
Measured by R²Coefficient of Determination, MAEMean Absolute Error, MSEMean Squared Error, RMSERoot Mean Squared Error.
C. Overall Model Performance
Random Forest & XGBoost excelled among classical models (R² ≈ 0.90).
| Dataset Variant | Best Model | R² | MAE | RMSE |
|---|---|---|---|---|
| GGDataset_a (MinMax + IQR) | Random Forest | 0.898 | 0.046 | 0.065 |
| GGDataset_b (MinMax + Z-Score) | Random Forest | 0.892 | 0.048 | 0.067 |
| GGDataset_c (StdScaler + IQR) | Random Forest | 0.898 | 0.226 | 0.313 |
| GGDataset_d (StdScaler + Z-Score) | Random Forest | 0.894 | 0.227 | 0.318 |


D. Hyperparameter Tuning
RandomizedSearchCV significantly boosted RF/XGBoost performance.
E. Transformer Model Results
Strong generalization (R² ≈ 0.82).

*MAE/RMSE likely reported on scaled data.
F. Ablation Study: Scaling
MinMaxScaler slightly better for classical models; Transformer less sensitive. Z-score impact minimal vs IQRInterquartile Range for outlier handling.
G. XAI Chatbot Results
RAGRetrieval-Augmented Generation chatbot effectively answered complex queries in real-time (<1s latency via GroqFast LLM Inference API), enhancing transparency.
Conclusion and Future Work
GridGenius presents a significant advancement in energy demand forecasting for Bangladesh. By integrating a novel dataset, hybrid modeling, and an interactive RAGRetrieval-Augmented Generation-based XAIExplainable Artificial Intelligence system, it addresses key limitations. The platform achieves high accuracy (R² ≈ 0.89) and offers unprecedented transparency.
The deployed system provides a practical, scalable tool for grid planners, offering a blueprint for intelligent energy management in developing economies.
- Data Expansion: Seek pre-2020 BPDB data.
- Model Refinement: Optimize Transformer (tuning, TCNs [30], Informer [31], multivariate attention [32]).
- LLMLarge Language Model Enhancement: Improve RAG (prompts, retrieval, LoRALow-Rank Adaptation [29]).
- Feature Integration: Add economic/operational data.
- Platform Evolution: Mobile-first UI, public APIsApplication Programming Interface.
References
- Bangladesh Power Development Board, "Bangladesh Power Development Board," [Online]. Available: https://www.bpdb.gov.bd/.
- A. Vaswani, et al., "Attention Is All You Need," arXiv:1706.03762, 2017. [Online]. Available: https://arxiv.org/abs/1706.03762.
- G. P. Reddy and Y. V. P. Kumar, "Explainable AI (XAI): Explained," 2023 IEEE eStream, pp. 1-6, doi: 10.1109/eStream59056.2023.10134984.
- P. Lewis, et al., "Retrieval-Augmented Generation for Knowledge-Intensive NLP Tasks," arXiv:2005.11401, 2020. [Online]. Available: https://arxiv.org/abs/2005.11401.
- M. Hossain, et al., "Short-Term Electricity Demand Forecasting of Dhaka City Using Machine Learning Approaches," arXiv:2406.06651, 2024.
- Y. Wang, et al., "Short-term power load forecasting using SSA-CNN-LSTM method," Syst. Sci. Control Eng., vol. 12, no. 1, pp. 1-12, 2024. doi: 10.1080/21642583.2024.2343297.
- H. Haque and M. A. Razzak, "Medium-Term Energy Demand Analysis Using Machine Learning," SSRN Electron. J., Aug. 2022. doi: 10.2139/ssrn.4197655.
- H. Haque, et al., "Long-term Energy Demand Analysis using Machine Learning Algorithms," 2024 6th Int. Conf. SGRE, pp. 1-6. doi: 10.1109/SGRE60102.2024.10815643.
- Q. Wen, et al., "Transformers in Time Series: A Survey," arXiv:2202.07125, 2022. [Online]. Available: https://arxiv.org/abs/2202.07125.
- H. Wu, et al., "Autoformer: Decomposition Transformers with Auto-Correlation for Long-Term Series Forecasting," arXiv:2106.13008, 2021. [Online]. Available: https://arxiv.org/abs/2106.13008.
- IBM, "Using the watsonx.ai Time Series Forecasting API to predict energy demand," IBM Developer, 2025. [Online]. Available: Link.
- D. P. Kingma and J. Ba, "Adam: A Method for Stochastic Optimization," arXiv:1412.6980, 2014. [Online]. Available: https://arxiv.org/abs/1412.6980.
- Chroma, "Chroma: The AI-native open-source embedding database," GitHub, 2023. [Online]. Available: https://github.com/chroma-core/chroma.
- Meta AI, "Introducing Llama 3.1," Meta AI Blog, 2024. [Online]. Available: https://ai.meta.com/blog/meta-llama-3-1/.
- Groq, "GroqCloud: Fast AI Inference," 2024. [Online]. Available: https://groq.com/.
- S. Ramírez, "FastAPI," 2023. [Online]. Available: https://fastapi.tiangolo.com/.
- Vercel, "Vercel Documentation," 2024. [Online]. Available: https://vercel.com/docs.
- F. Pedregosa, et al., "Scikit-learn: Machine Learning in Python," JMLR, vol. 12, pp. 2825-2830, 2011.
- M. Abadi, et al., "TensorFlow: Large-scale machine learning on heterogeneous systems," arXiv:1603.04467, 2016. [Online]. Available: https://arxiv.org/abs/1603.04467.
- A. Paszke, et al., "PyTorch: An Imperative Style, High-Performance Deep Learning Library," NeurIPS, 2019.
- F. Chollet, "Keras," GitHub, 2015. [Online]. Available: https://github.com/keras-team/keras.
- C. R. Harris, et al., "Array programming with NumPy," Nature, vol. 585, pp. 357-362, 2020.
- W. McKinney, "Data Structures for Statistical Computing in Python," Proc. 9th Python Sci. Conf., 2010, pp. 51-56.
- J. D. Hunter, "Matplotlib: A 2D Graphics Environment," Comput. Sci. Eng., vol. 9, no. 3, pp. 90-95, 2007.
- M. Waskom, "Seaborn: Statistical Data Visualization," J. Open Source Softw., vol. 6, no. 60, p. 3021, 2021.
- Google, "Google Cloud AI Platform," 2024. [Online]. Available: https://cloud.google.com/ai-platform.
- Hugging Face, "Hugging Face Transformers," 2024. [Online]. Available: https://huggingface.co/transformers/.
- Railway, "Railway: Infrastructure for Developers," 2024. [Online]. Available: https://railway.app/.
- E. Hu, et al., "LoRA: Low-Rank Adaptation of Large Language Models," arXiv:2106.09685, 2021. [Online]. Available: https://arxiv.org/abs/2106.09685.
- S. Bai, et al., "An Empirical Evaluation of Generic Convolutional and Recurrent Networks for Sequence Modeling," arXiv:1803.01271, 2018. [Online]. Available: https://arxiv.org/abs/1803.01271.
- H. Zhou, et al., "Informer: Beyond Efficient Transformer for Long Sequence Time-Series Forecasting," AAAI, 2021. [Online]. Available: https://arxiv.org/abs/2012.07436.
- H. Wu, "Revisiting Attention for Multivariate Time Series Forecasting," arXiv:2407.13806, 2024. [Online]. Available: https://arxiv.org/abs/2407.13806.